Food Prices in Turkey: How Much Each Food Has Risen
Bread, eggs, cheese, meat and vegetables: how much each food group has risen in Turkey since any month you pick, from TÜİK price indexes.
Table of Contents
Shop prices in Türkiye change fast, so a price quoted today is out of date within weeks. TÜİK’s consumer price indexes measure change instead: how much each food has risen since a month you pick, and whether it rose faster or slower than prices overall.
The short version
Food and drinks: +27.6% in a year. Prices overall: +29.7%.
- One year: cheese +40.0%, bread +24.9%, eggs −3.4% in the 12 months to September 2026 (TÜİK indexes).
- The rope: on the shelf, a food whose crate stands above the rope rose faster than prices overall; one below it rose slower or fell.
- Not a price: an index shows change from a month you choose, not what a kilo costs. Prices differ by shop, city and day.
- At the shelf: a label must show the unit price, the price per kilo, litre or piece. Compare that, not the pack price.
- Online: fresh food that spoils quickly has no 14-day withdrawal right in a distance sale.
How much has each food risen?
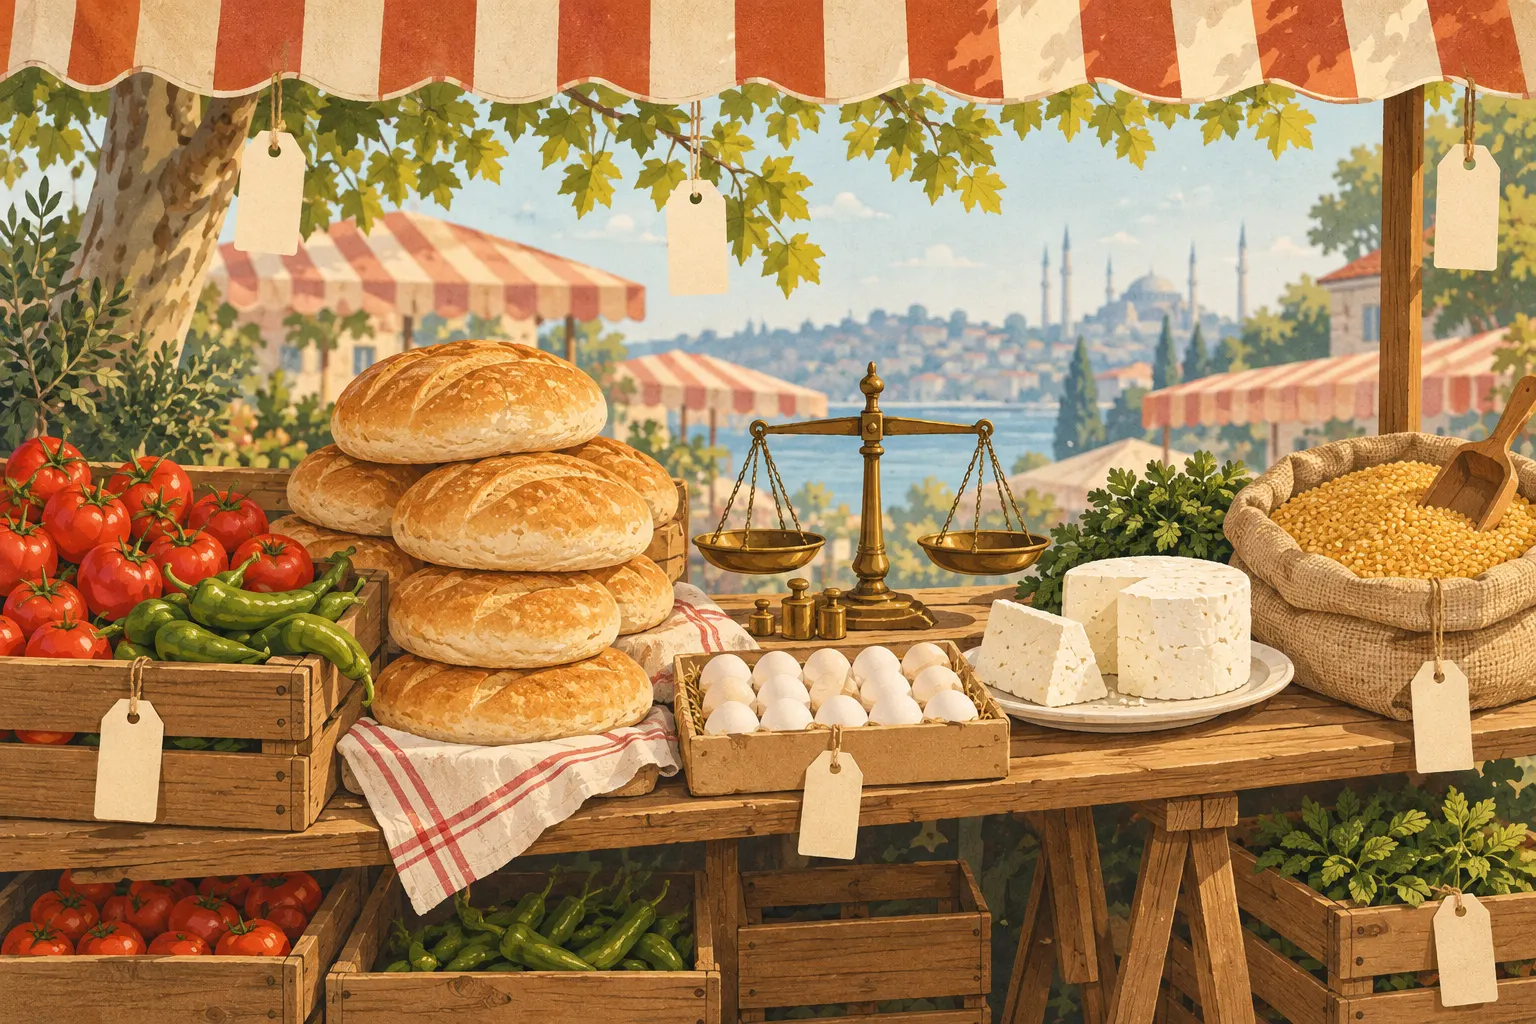
Twenty foods stand on four shelves. Pick a start month, a preset or a food, and read the crates, or type your own amounts under “Your shop”.
The shelf
Pick a month. The crates grow.
Each food stands on a crate as tall as its TÜİK price index has grown since the month you pick. The dashed rope is prices overall: a crate above it rose faster.
The month picker needs the live figures, which did not load. The shelf shows the change since September 2025.
Since September 2025, prices overall: +29.7%. 7 of 20 foods on the shelf rose faster.
Rope: prices overall (TÜİK headline index) +29.7%
Bread and grains
Dairy and eggs
Meat, fish and the pantry
Fruit and vegetables
Your shop
The same shop, with today’s indexes
Type what you spent on each group in the start month, in any currency and any unit. The shelf has no prices of its own: it applies each group’s TÜİK index to your numbers.
The same figures as a table
| Food | Index, September 2025 | Index, September 2026 | Change | Against prices overall (points) |
|---|---|---|---|---|
| Prices overall (headline index) | 105.78 | 137.23 | +29.7% | – |
| Bread Ekmek ve Unlu Mamuller | 107.26 | 133.96 | +24.9% | −4.8 |
| Flour Tahıl Unları | 108.13 | 129.34 | +19.6% | −10.1 |
| Grains Tahıllar | 103.01 | 122.45 | +18.9% | −10.9 |
| Pasta Makarna, Erişte, Kuskus ve Benzeri Makarna Ürünleri | 103.15 | 129.24 | +25.3% | −4.4 |
| Dried legumes Kuru Baklagiller | 102.31 | 125.06 | +22.2% | −7.5 |
| Milk Çiğ ve Tam Yağlı Süt | 103.68 | 152.48 | +47.1% | +17.3 |
| Yogurt Yoğurt ve Benzeri Ürünler | 105.57 | 145.76 | +38.1% | +8.3 |
| Cheese Peynir | 103.37 | 144.71 | +40.0% | +10.3 |
| Eggs Yumurtalar | 106.13 | 102.51 | −3.4% | −33.1 |
| Butter Tereyağı ve Sütten Elde Edilen Diğer Yağlar | 105.77 | 153.90 | +45.5% | +15.8 |
| Meat Et, Taze, Soğutulmuş veya Dondurulmuş | 104.25 | 143.56 | +37.7% | +8.0 |
| Fish Balıklar, Canlı, Taze, Soğutulmuş veya Dondurulmuş | 113.93 | 115.66 | +1.5% | −28.2 |
| Cooking oil Bitkisel Sıvı Yağlar | 108.97 | 132.17 | +21.3% | −8.4 |
| Sugar Şeker | 105.10 | 119.19 | +13.4% | −16.3 |
| Tea Çay ve Demlenerek Hazırlanan Diğer Bitkisel Ürünler | 108.06 | 155.47 | +43.9% | +14.1 |
| Tomatoes, peppers Meyvesi Yenen Sebzeler, Taze veya Soğutulmuş Domates, Biber, Salatalık, Kabak Vb. | 90.23 | 116.63 | +29.3% | −0.5 |
| Root vegetables Yumrulu Sebzeler | 89.42 | 200.58 | +124.3% | +94.6 |
| Leafy greens Yeşil Yapraklı veya Saplı Sebzeler, Taze veya Soğutulmuş | 112.15 | 83.45 | −25.6% | −55.3 |
| Citrus fruit Turunçgiller, Taze | 111.07 | 75.39 | −32.1% | −61.9 |
| Apples, stone fruit Sert Çekirdekli ve Yumuşak Çekirdekli Meyveler, Taze | 122.81 | 105.20 | −14.3% | −44.1 |
| Groups used in “Your shop” | ||||
| Bread and grains Tahıllar ve Tahıl Ürünleri | 106.74 | 132.13 | +23.8% | −5.9 |
| Meat Canlı Hayvanlar, Kesilen Kara Hayvanlarının Etleri ve Diğer Kısımları | 104.06 | 143.39 | +37.8% | +8.1 |
| Milk, cheese and eggs Süt, Diğer Süt Ürünleri ve Yumurtalar | 104.30 | 137.69 | +32.0% | +2.3 |
| Oils and fats Sıvı ve Katı Yağlar | 108.28 | 138.29 | +27.7% | −2.0 |
| Fruit and nuts Meyveler ve Sert Kabuklu Meyveler | 107.40 | 106.34 | −1.0% | −30.7 |
| Vegetables and legumes Sebzeler, Yumrulu Sebzeler, Plantainler, Yemeklik Muzlar ve Bakliyat | 97.09 | 135.41 | +39.5% | +9.7 |
Reading the shelf. The figures are TÜİK consumer price indexes (2025=100) via TCMB EVDS, for the latest month and the month you pick. A crate is as tall as the food’s index has grown since then; the rope is the headline index over the same months. The tags show the change, and the tables hold every number.
Reading an index
An index starts at 100 in a base period, here the year 2025. The index for bread and bakery products stands at 133.96 in September 2026 and stood at 107.26 in September 2025. The change between two months is the later number divided by the earlier one, minus one.
Worked example: bread
133.96 ÷ 107.26 = 1.249, which is +24.9%. Prices overall: 137.23 ÷ 105.78 gives +29.7%, so bread’s change stands −4.8 percentage points against prices overall.
- Same months for every food. Compare changes only over the same start and end months.
- A fall shows as a minus. Some foods cost less than a year ago, and the shelf shows them as such.
- The rope is not a price. A food above the rope rose faster than prices overall. That does not say it is dearer than another food.
TÜİK’s method notes describe what stands behind the numbers. The index follows the price of a fixed basket of goods and services bought by households; prices include all taxes, such as VAT and special consumption tax, and are cash prices. Prices come from visits by TÜİK’s staff to shops in all 81 provinces, from chain-store barcode data and from web prices.
TÜİK builds the index as a chained Laspeyres index and renews the basket and its weights every December from the household budget survey. Seasonal foods carry the same weight in every month of the year, and a seasonal calendar says in which months their prices are collected.
Food group by group
TÜİK splits food and drinks into groups. Each card gives the change over the 12 months to September 2026 for the group and its main classes.
+23.8% in a year
Bread and bakery products +24.9%, flour +19.6%, pasta +25.3%. Bread is sold by the loaf or by weight and flour by the bag, so compare by the kilo.
+32.0% in a year
Milk +47.1%, yogurt +38.1%, cheese +40.0%, eggs −3.4%. Eggs are sold by the count: compare the price per egg and the size of the egg.
Meat +37.8%, fish +4.8%
Fresh meat +37.7%, cured meat +43.9%, fresh fish +1.5%. A cut is sold by the kilo, so compare the unit price, not the tray.
Fruit −1.0%, vegetables +39.5%
Fresh produce moves with the seasons. For berries, other fresh fruit and fresh green legumes, TÜİK publishes no value in some months: the shelf shows a dash there, never zero.
Oils and fats +27.7%, sugar and sweets +19.4%
Vegetable oils +21.3%, butter +45.5%, sugar +13.4%, dried legumes +22.2%. Oil is sold by the litre and sugar by the kilo.
+34.9% in a year
Tea +43.9%, coffee +19.8%, water +39.0%, soft drinks +32.2%, juice +25.9%.
At the stall and on the shelf
Whatever an index says, the price you pay is on a label. The Ministry of Trade’s price-label rules say what the label must show:
- Unit price: a label shows the price per kilo, litre or piece (birim fiyat) next to the price of the pack.
- Loose goods: at a stall or a greengrocer’s (manav) the label may show only the unit price. A bowl or tray is weighed empty and taken off (dara); a thin bag or film does not count.
- Origin: the label says where the food was produced, in Turkish, and for an imported food the country.
- Since when: the label carries the date from which the price applies.
- Shelf and till: if the shelf price and the till price differ, the price in the buyer’s favour applies.
- Discounts: for most goods the “before” price is the lowest price of the ten days before the discount. For perishables such as fruit and vegetables it is the price just before it.
Neither a weekly market (pazar) nor a supermarket (market) is lower on every food or every day. Compare the unit price of the same item at both on the same day.
- manav
- greengrocer
- pazar
- weekly market
- bakkal
- corner shop
- kasap
- butcher
- yarım kilo, bir kilo
- half a kilo, one kilo
- yerli, ithal
- domestic, imported
- dana kıyma
- minced beef
- dana kuşbaşı
- cubed beef
- tavuk, piliç
- chicken, broiler chicken
- fileto
- fillet
- birim fiyat
- unit price
- dara
- tare, the weight of the container
Kilosu ne kadar?How much is a kilo?
Yarım kilo alabilir miyim?Can I have half a kilo?
Groceries online
An online grocery order is a distance sale, and its rules differ from the stall’s.
Can I send back fresh food?
Under the distance-selling rules, no withdrawal right applies to goods that spoil quickly or whose use-by date can pass soon. Other goods keep the 14 days to withdraw without a reason.
What about an opened pack?
Under the same rules, a withdrawal right does not apply to goods whose seal or packaging was opened after delivery when returning them is not suitable for health and hygiene reasons.
What do I check at the door?
Check the use-by date (son kullanma tarihi) and the net quantity on the pack against the order. A food that arrives spoilt or short is a fault to report to the seller at once.
Son kullanma tarihi ne zaman?When is the use-by date?
Sources and limits
Index numbers: TÜİK, via the TCMB EVDS series, for September 2026 (checked 21 October 2026).
- What the numbers are: TÜİK consumer price index (2025=100), by class of food, monthly from January 2005 as TCMB EVDS carries the series.
- What they are not: shop prices. The index follows TÜİK’s basket, not yours, so your own shop can move differently.
- No value: in some months TÜİK publishes no value for a class, mostly seasonal fruit and vegetables. The shelf shows a dash.
- Revisions: TÜİK’s method notes state that no revision is applied to the published data.
Read the sources
- TÜİK: Tüketici Fiyat Endeksi (consumer price index), monthly bulletins and tables — Turkish Statistical Institute, checked 21 October 2026
- TÜİK: Consumer price index, method notes (metadata of the bulletin) — Turkish Statistical Institute, checked 21 October 2026
- TCMB EVDS: consumer price index (2025=100), item series of TÜİK — Central Bank of the Republic of Türkiye, checked 21 October 2026
- Fiyat Etiketi Yönetmeliği (Price Label Regulation), consolidated text, articles 4, 5, 9, 10 and 11 — Ministry of Trade, checked 21 October 2026
- Mesafeli Sözleşmeler Yönetmeliği (Distance Contracts Regulation), consolidated text, articles 9 and 15 — Ministry of Trade, checked 21 October 2026