
Turkey’s Foreign Trade Indices: Complete Analysis & Data
Table of Contents
Turkey’s foreign trade indices tell a story that goes beyond simple export and import numbers. While the Turkish Statistical Institute (TÜİK) regularly publishes these metrics, understanding what they reveal about economic performance requires looking at both unit values and volume changes across different sectors.
Important Note: As of January 2026, TÜİK has not yet released Foreign Trade Indices for January 2026. The publishing schedule typically runs with a reporting lag of several weeks. Check the TÜİK data portal for the latest bulletins.
Understanding Export Performance Metrics
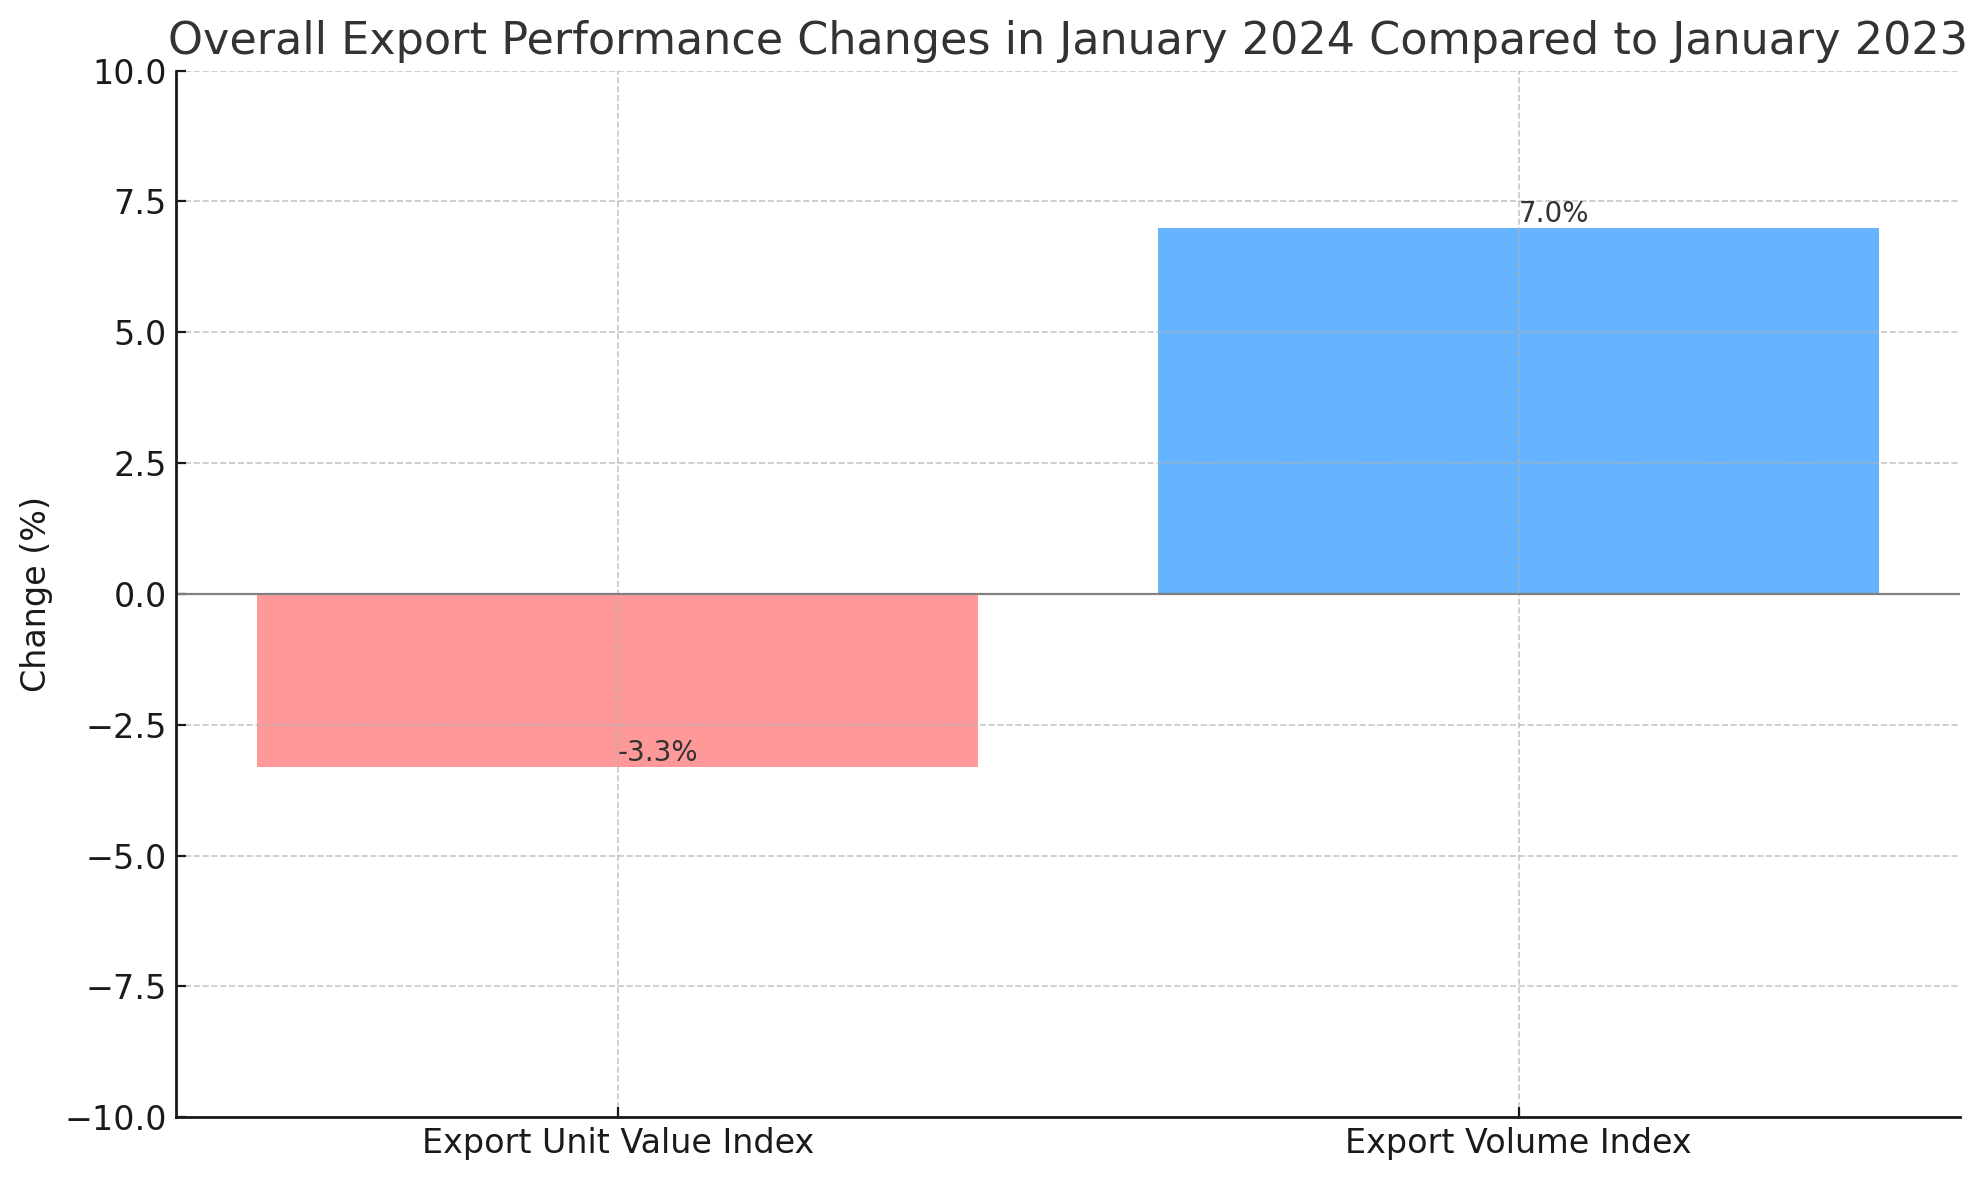
When analyzing Turkey’s export data, two key indices matter: unit value and volume. The unit value index tracks price changes, while the volume index measures actual quantity shipped. Here’s what recent patterns show:
- Export unit values can drop while volumes rise—meaning Turkey sells more goods at lower prices
- Volume increases often signal improved competitiveness in international markets
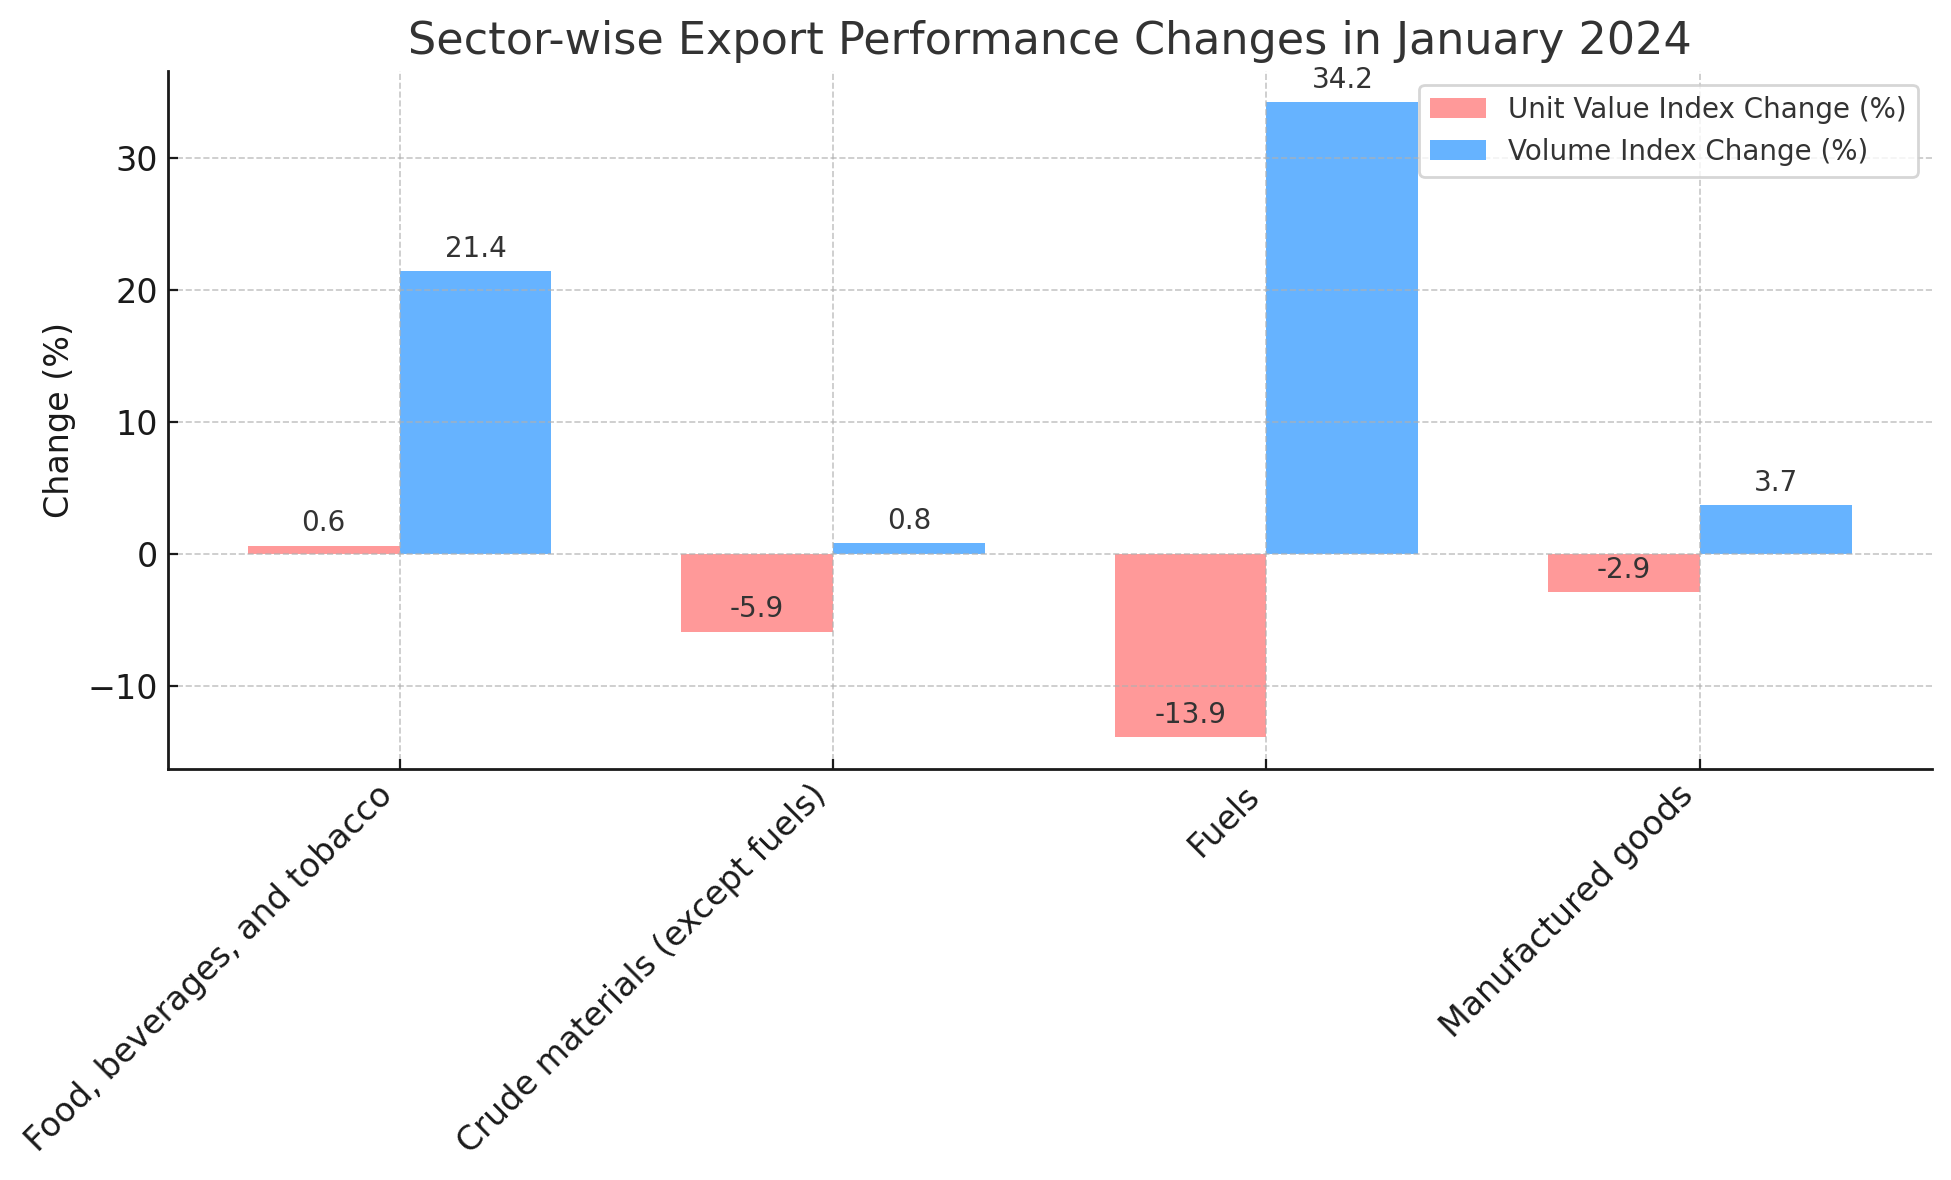
- Sector-specific trends reveal which industries drive growth
Historical data shows significant variation across sectors. Food, beverages, and tobacco typically show strong volume growth, while manufactured goods demonstrate steadier but smaller gains. The fuel sector often experiences the most volatility due to global commodity price swings.
Sector-by-Sector Export Breakdown
Different sectors behave differently in export markets. Recent patterns reveal:
| Sector | Typical Unit Value Trend | Volume Behavior |
|---|---|---|
| Food, beverages and tobacco | Stable to slightly increasing | Strong growth potential |
| Crude materials (except fuels) | Commodity-price dependent | Moderate fluctuation |
| Fuels | Highly volatile | Supply-driven changes |
| Manufactured goods | Competitive pressure | Steady moderate growth |
Insider tip: If you’re in export business, watch the manufactured goods volume index closely. It’s less prone to commodity price shocks and better reflects Turkey’s industrial competitiveness.
Import Performance and What It Means
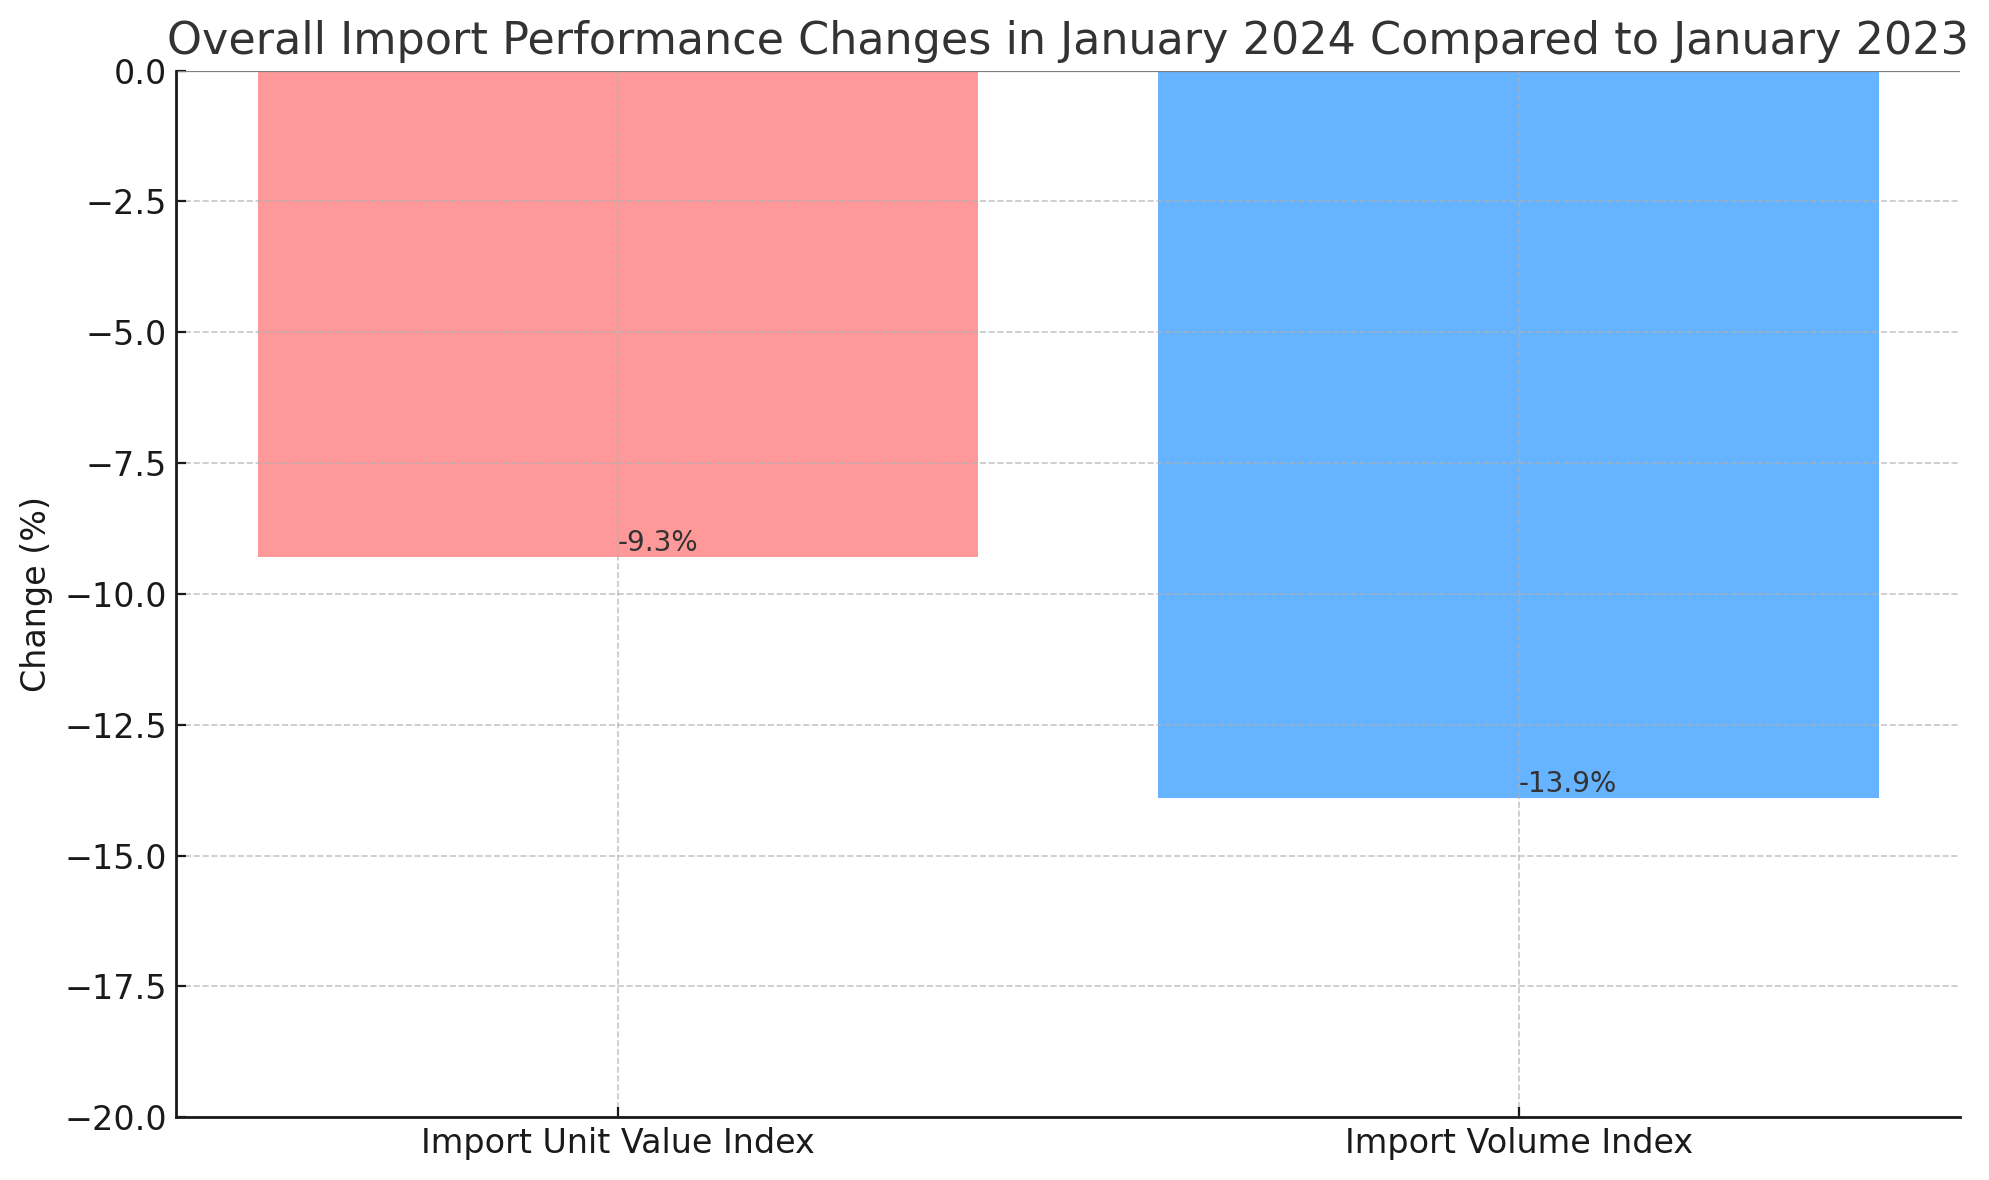
Import indices work the same way as export metrics, but tell a different story about Turkey’s economy. When both unit values and volumes drop together, it often signals reduced domestic demand or successful import substitution policies.
- Falling import volumes can indicate economic slowdown or rising local production
- Unit value decreases often reflect global commodity price drops
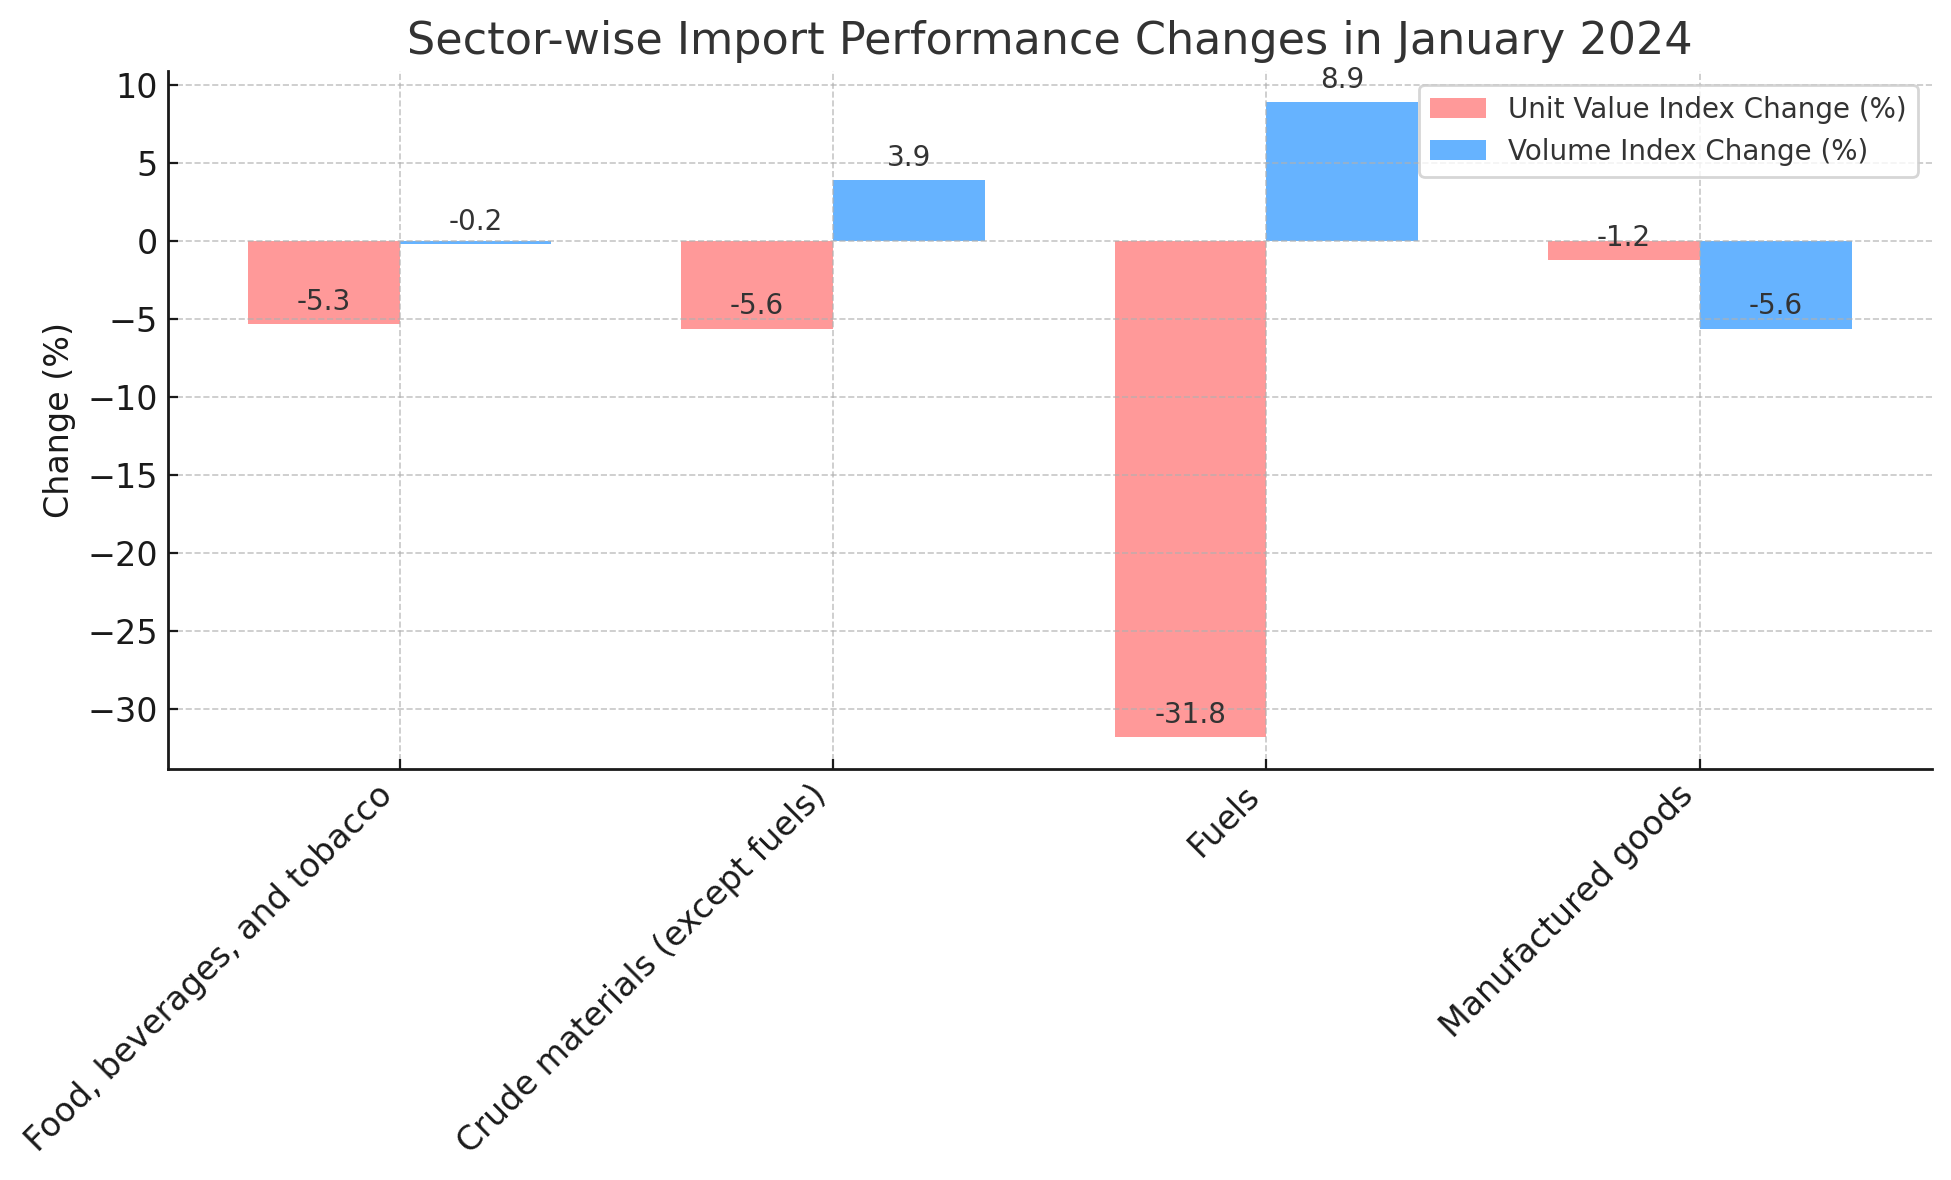
- The fuel sector dominates import trends due to Turkey’s energy dependence
Import Sector Analysis
Breaking down import behavior by sector reveals economic priorities and vulnerabilities:
| Sector | Economic Significance | Policy Sensitivity |
|---|---|---|
| Food, beverages and tobacco | Consumer price impact | Moderate |
| Crude materials (except fuels) | Industrial input costs | High |
| Fuels | Energy security | Very high |
| Manufactured goods | Technology & capital goods | High |
The fuel sector deserves special attention. Even small percentage changes in fuel import values translate to billions of dollars because of the sheer volume involved. That’s why energy policy decisions ripple through the entire trade balance.
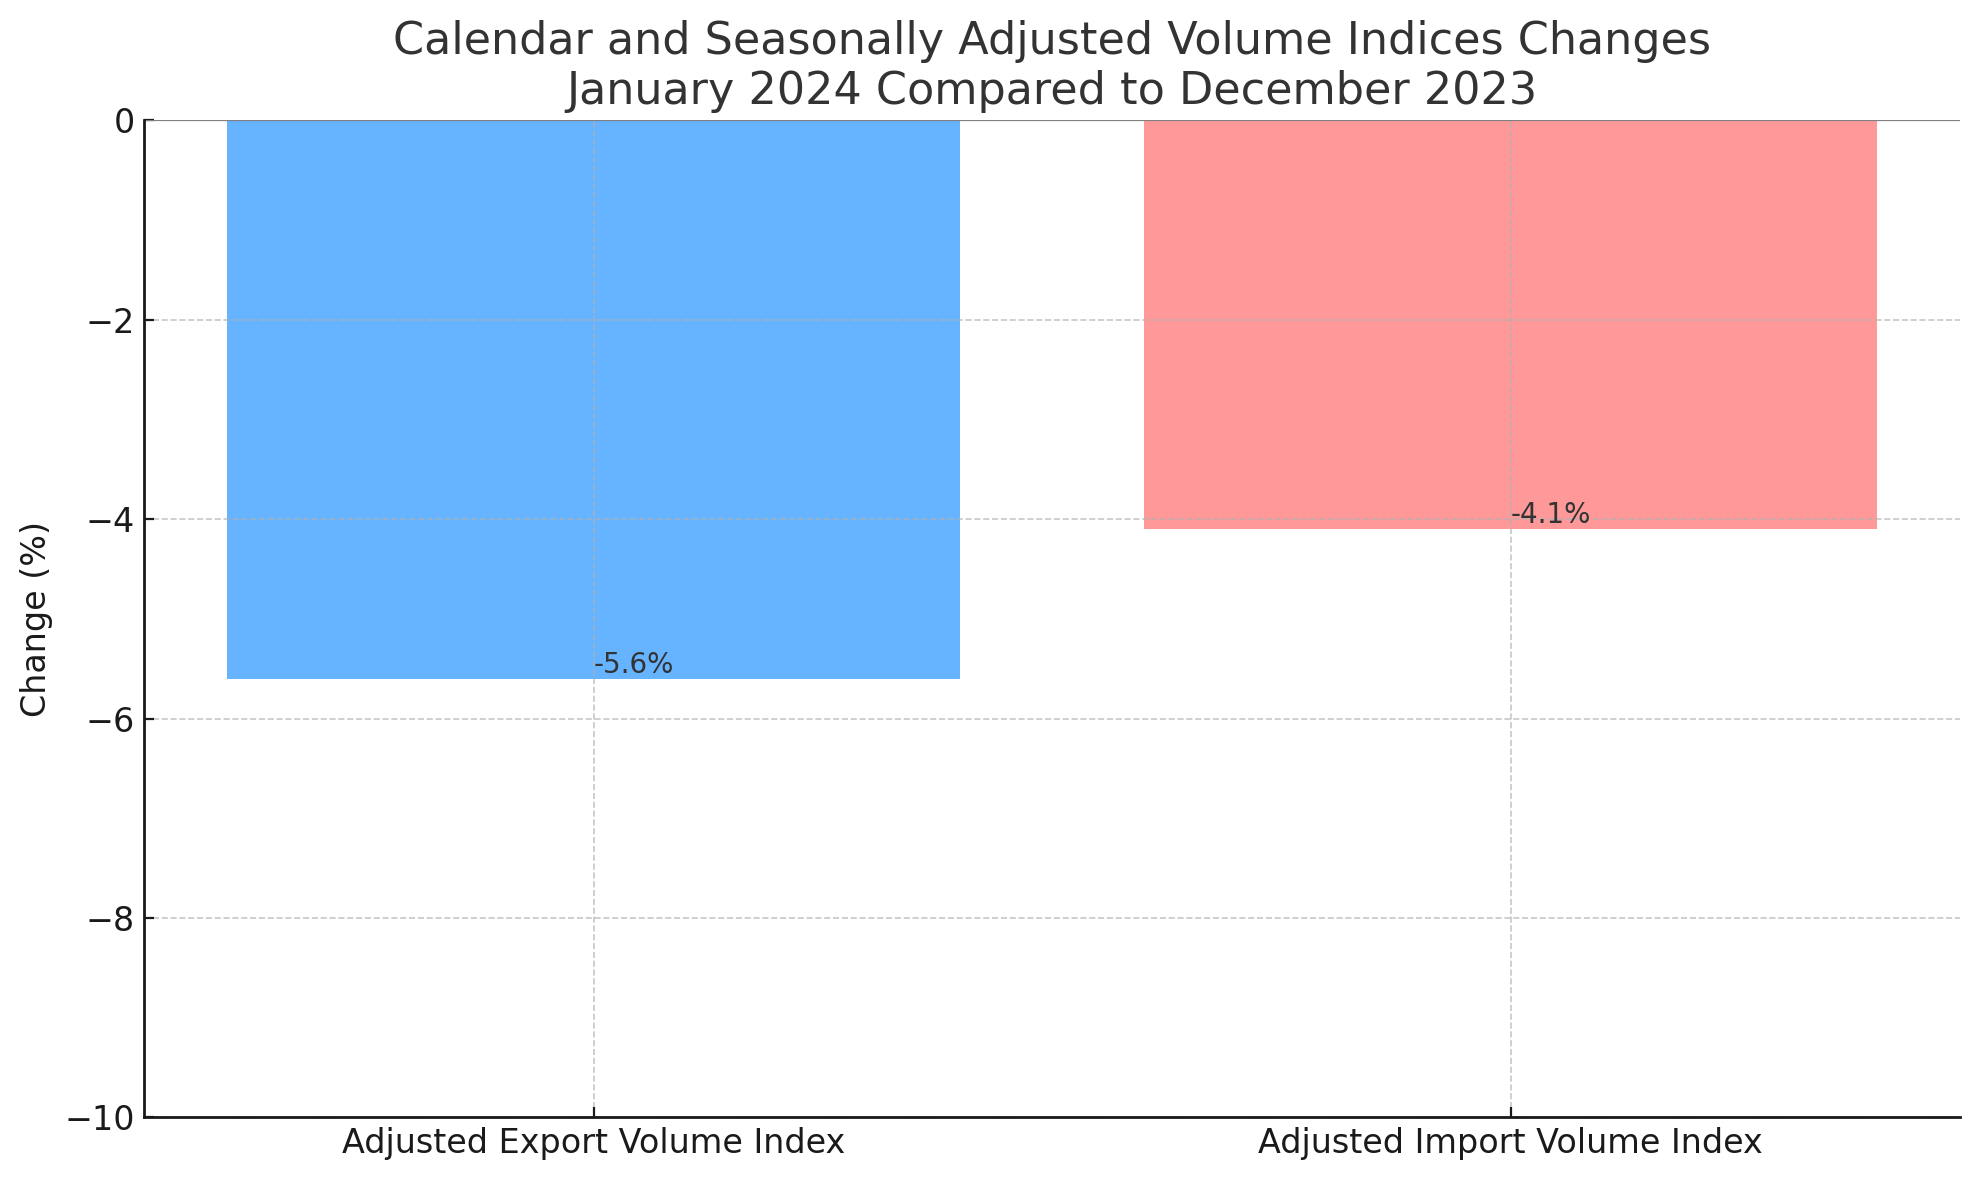
Calendar and Seasonally Adjusted Indices
Raw trade data contains noise from holidays, seasonal patterns, and calendar effects. TÜİK publishes adjusted indices that strip out these distortions, giving you a clearer picture of underlying trends.
- Month-to-month comparisons only make sense with adjusted data
- Seasonal adjustments account for predictable patterns like Ramadan or summer shutdowns
- Calendar adjustments handle working day differences between months
These adjusted figures matter more for economic policy analysis. If you’re tracking whether exports are truly growing or just experiencing seasonal upswing, adjusted indices give you the answer.
Practical advice: When comparing consecutive months, always use adjusted indices. When comparing year-over-year (January to January), raw indices work fine because seasonal patterns cancel out.
Terms of Trade: The Big Picture Metric
The terms of trade index answers a simple question: Are we getting more or less bang for our buck in international trade? Calculate it by dividing export unit values by import unit values and multiplying by 100.
When this number rises, it means Turkey’s exports buy more imports than before—a positive development. When it falls, the country needs to export more volume just to afford the same import basket.
Why it matters:
- Improving terms of trade boost national income without producing more
- Worsening terms of trade act like a hidden tax on the economy
- Commodity exporters see wild swings in this metric
- Manufactured goods exporters typically enjoy more stability
For businesses engaged in international trade, understanding terms of trade helps with strategic planning. If the index trends downward, profit margins face pressure unless you can boost productivity or find higher-value export markets.
Exchange Rate Context
Foreign trade indices can’t be understood in isolation from exchange rates. As of January 2026, the Turkish lira trades at approximately 43.04 TRY per USD and 50.30 TRY per EUR according to Central Bank of the Republic of Türkiye (CBRT) indicative rates.
Exchange rate movements directly impact trade indices. A weaker lira typically boosts export competitiveness (higher volumes) while making imports more expensive (higher unit values). This dynamic plays out across all sectors but hits energy imports particularly hard.
How to Use This Data
Whether you’re a business owner, economist, or investor, here’s how to make foreign trade indices work for you:
For exporters: Track your sector’s volume index to gauge competitiveness. If volumes rise while unit values fall, you’re gaining market share but might need to move upmarket. If both decline, reassess your product-market fit.
For importers: Monitor unit value trends in your input categories. Falling import unit values present opportunities to lock in lower costs through forward contracts. Rising values signal the need for local supplier development or hedging strategies.
For investors: Trade indices predict currency pressure before it shows up in reserves. Persistently weak export volumes combined with strong import volumes spell trouble for the lira—and opportunity for positioned traders.
For policy watchers: The gap between raw and adjusted indices reveals whether government interventions are working. If adjusted export volumes rise while raw figures stay flat, seasonal policies might be backfiring.
Where to Find Current Data
TÜİK publishes Foreign Trade Indices monthly through their official data portal at https://data.tuik.gov.tr. The Central Bank of the Republic of Türkiye provides complementary exchange rate and balance of payments data at https://www.tcmb.gov.tr.
Set up alerts for new releases if trade data matters to your business. The first few days after publication often see market reactions that create short-term opportunities.
References
Turkish Statistical Institute (TÜİK), Foreign Trade Indices – Data Portal
Central Bank of the Republic of Türkiye (CBRT), Indicative Exchange Rates
Official Sources:
https://data.tuik.gov.tr
https://www.tcmb.gov.tr